Beer, Wine and Spirits
Let’s first load the libraries which we will need to work on this assignment:
Back in 2014, fivethiryeight.com published an article on alcohol consumption in different countries. The data drinks is available as part of the fivethirtyeight package. So, let’s have a look at the data we have:
library(fivethirtyeight)
data(drinks)skim(drinks)| Name | drinks |
| Number of rows | 193 |
| Number of columns | 5 |
| _______________________ | |
| Column type frequency: | |
| character | 1 |
| numeric | 4 |
| ________________________ | |
| Group variables | None |
Variable type: character
| skim_variable | n_missing | complete_rate | min | max | empty | n_unique | whitespace |
|---|---|---|---|---|---|---|---|
| country | 0 | 1 | 3 | 28 | 0 | 193 | 0 |
Variable type: numeric
| skim_variable | n_missing | complete_rate | mean | sd | p0 | p25 | p50 | p75 | p100 | hist |
|---|---|---|---|---|---|---|---|---|---|---|
| beer_servings | 0 | 1 | 106.16 | 101.14 | 0 | 20.0 | 76.0 | 188.0 | 376.0 | ▇▃▂▂▁ |
| spirit_servings | 0 | 1 | 80.99 | 88.28 | 0 | 4.0 | 56.0 | 128.0 | 438.0 | ▇▃▂▁▁ |
| wine_servings | 0 | 1 | 49.45 | 79.70 | 0 | 1.0 | 8.0 | 59.0 | 370.0 | ▇▁▁▁▁ |
| total_litres_of_pure_alcohol | 0 | 1 | 4.72 | 3.77 | 0 | 1.3 | 4.2 | 7.2 | 14.4 | ▇▃▅▃▁ |
glimpse(drinks)## Rows: 193
## Columns: 5
## $ country <chr> "Afghanistan", "Albania", "Algeria", "And…
## $ beer_servings <int> 0, 89, 25, 245, 217, 102, 193, 21, 261, 2…
## $ spirit_servings <int> 0, 132, 0, 138, 57, 128, 25, 179, 72, 75,…
## $ wine_servings <int> 0, 54, 14, 312, 45, 45, 221, 11, 212, 191…
## $ total_litres_of_pure_alcohol <dbl> 0.0, 4.9, 0.7, 12.4, 5.9, 4.9, 8.3, 3.8, …After cleaning the data I decided to use bar plots to look at the consumption of the top drinking countries. I used the ggplot package to produce the following graphs. Below you can see the three graphs for the top 25 beer, wine and spirit drinking countries:
Plot that shows the top 25 beer consuming countries
drinks%>%
  slice_max(order_by = beer_servings, n=25) %>%
  ggplot(aes(x=beer_servings, y=fct_reorder(country, beer_servings), color = country))+
  geom_col()+
  labs(
    title = "Top 25 beer consuming countries",
    x = "Cans of beer consumed per person",
    y = "Country"
  ) +
  NULL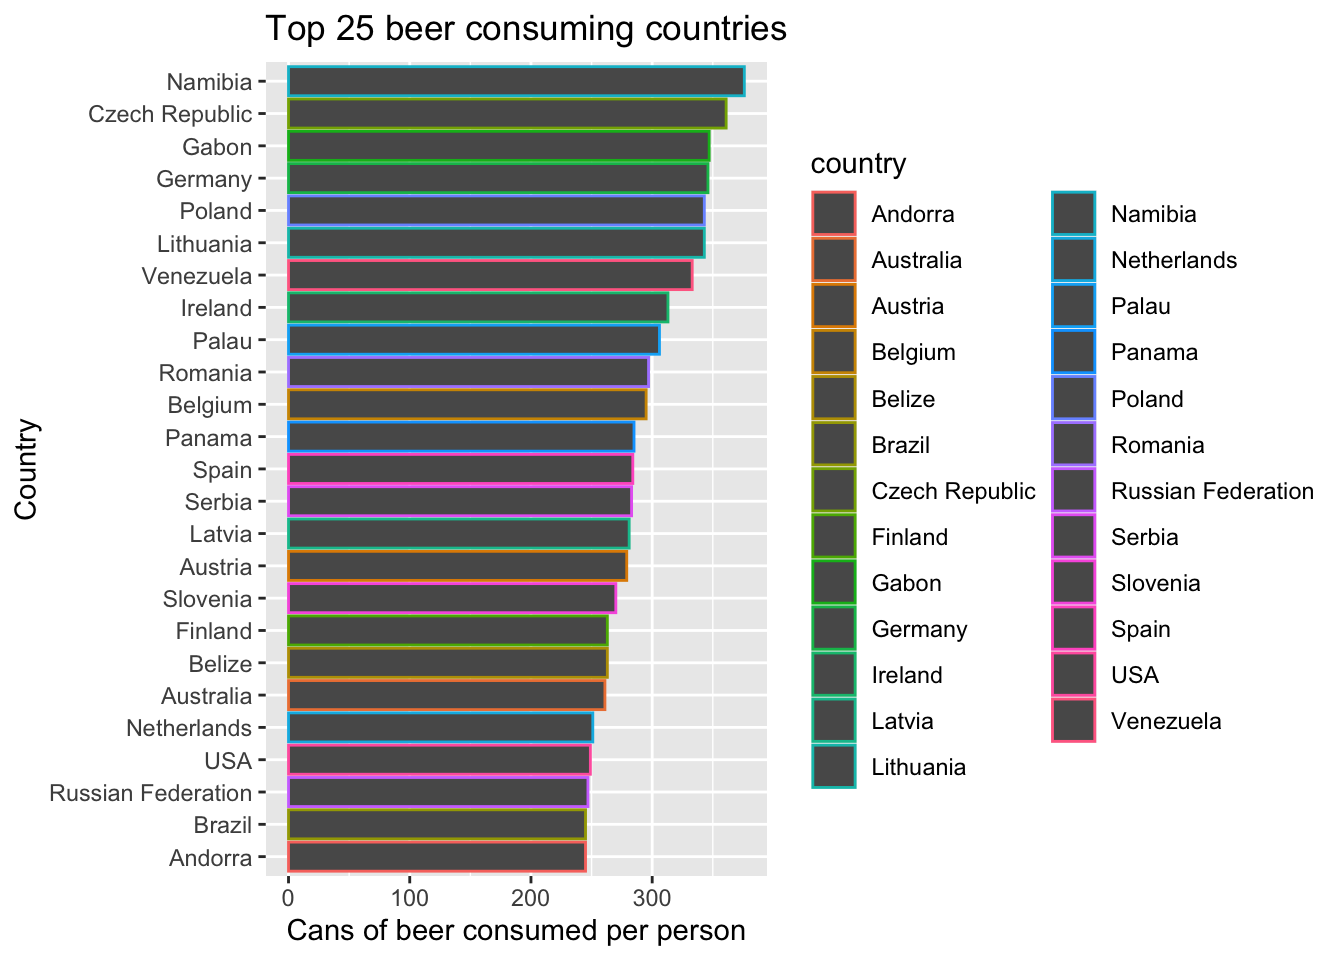
It is certainly no surprise that people in Czech are among the most beer-consuming countries, but Namibia is a little surprising with about 370 yearly beer cans consumed per person. That implies every person drinks on average about 1 beer per day. However, Namibia is a German colony and therefore has adopted the German Beer drinking traditions. A little surprising is the fact that Germany didn’t make it into the Top 3, but Gabon has.
Plot that shows the top 25 wine consuming countries
drinks %>%
  slice_max(order_by = wine_servings, n=25) %>%
  ggplot(aes(x=wine_servings, y=fct_reorder(country,wine_servings), color = country))+
  geom_col()+
  labs(
    title = "Top 25 wine consuming countries",
    subtitle = "",
    x = "Glasses of wine consumed per person",
    y = "Country"
  )+

  NULL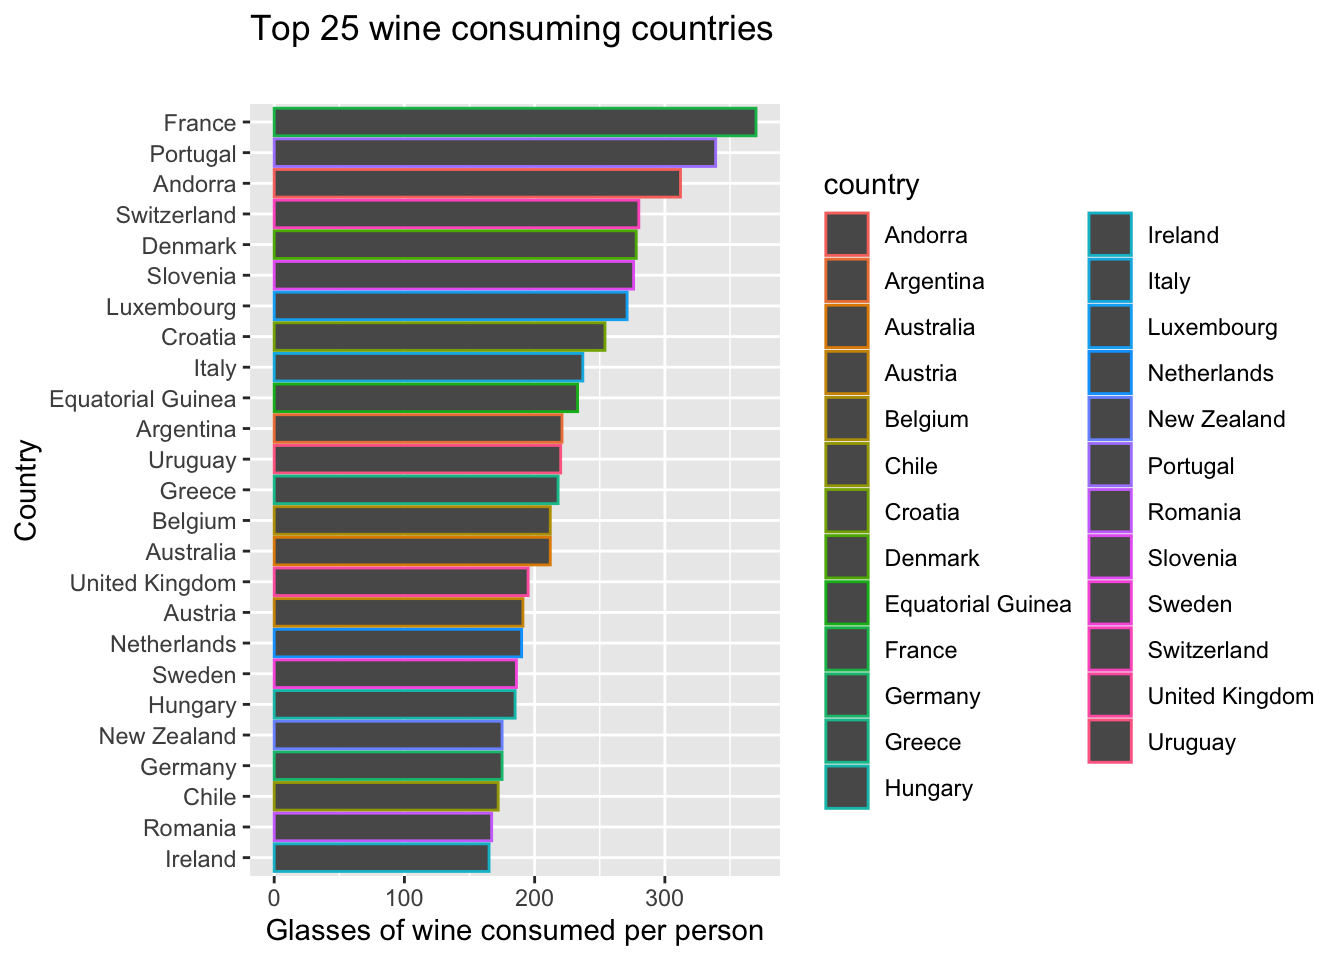
Regarding wine consumption, it is no surprise that people in France are the heaviest consumers having several world famous wineries. The average consumption is about 370 glasses of wine per person per year.
Finally, A plot that shows the top 25 spirit consuming countries
drinks %>%
  slice_max(order_by = spirit_servings, n=25) %>%
  ggplot(aes(x=spirit_servings, y=fct_reorder(country,spirit_servings), color = country))+
  geom_col()+
  labs(
    title = "Top 25 spirit consuming countries",
    subtitle = "",
    x = "Shots of spirit consumed per person",
    y = "Country"
  )+

  NULL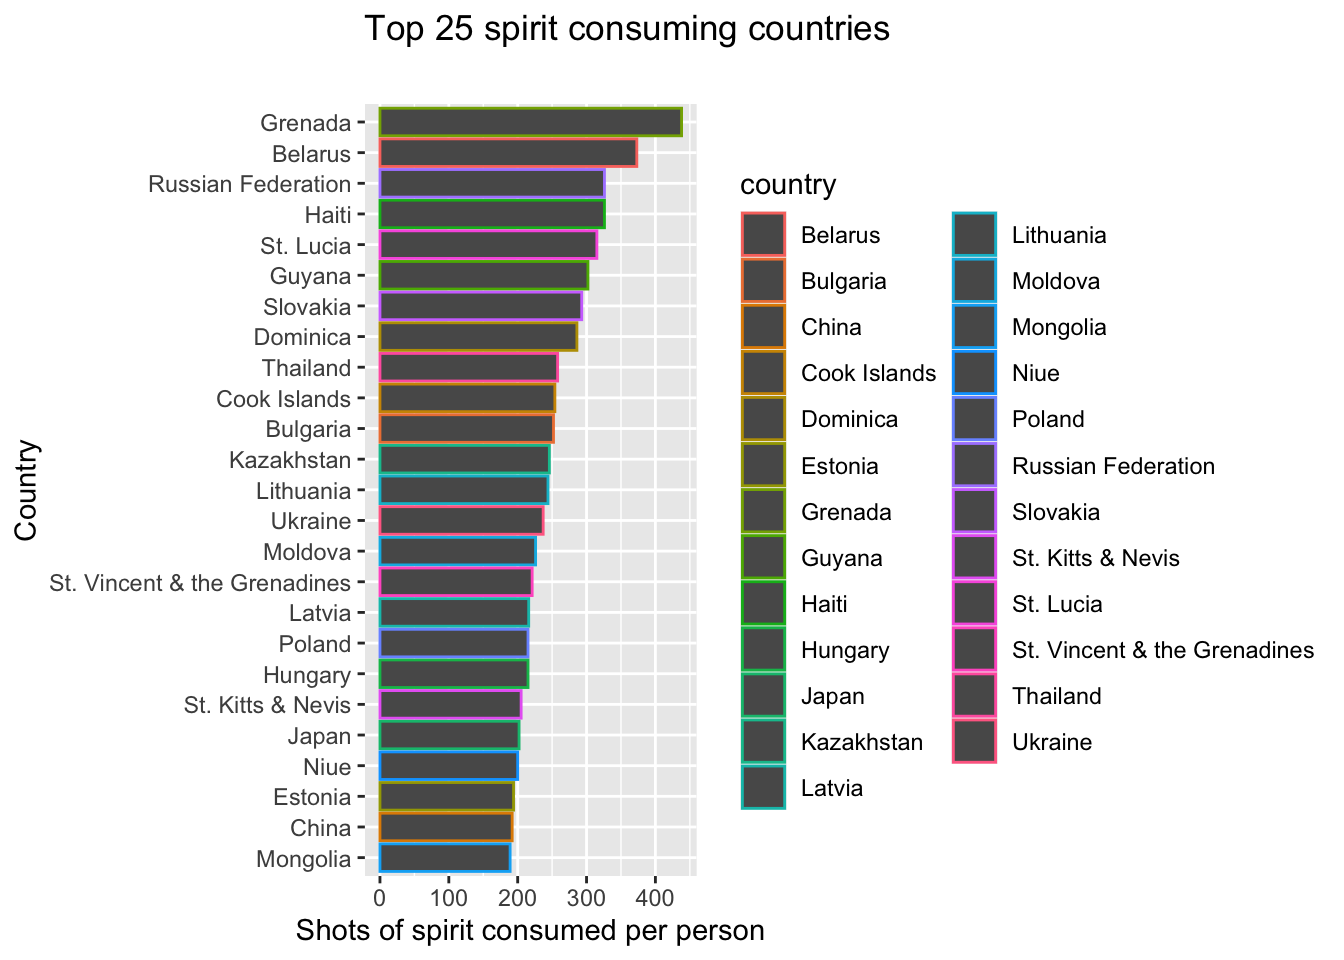
Last but not least, Russia and Belarus are no surprise to be placed in the Top 3 spirit consumers with their popularity for drinking vodka, with about 370 and 320 shots of spirit consumed per person, respectively. A bit more interesting is Grenada leading the table, with approximately 430 servings per person, but a Caribbean country like itself probably has the right environment for a lot of rum drinking on the beach.
In general, we can see that more than half of the top 25 beer and wine drinking countries come from Europe which are countries that tend to be more developed and have a higher GDP. In comparison, top spirit drinking countries tend to be more developing countries such as Grenada and Haiti. This may be explained by the fact that wine and beer are more expensive to purchase than spirits thus people in developing countries opt for cheaper alternatives when it comes to drinking. Furthermore, such national or continental differences in alcohol tastes could also be explained by the national availability of the ingredients to make this alcohol. For France, there has been enormous productions of grapes every year for manufacturing wine. For Germany, barley has been one of their main crops, which is then used for beer fermenting. For Japan and China, rice, their main crop, has been widely used to produce spirits. Moreover, these differences in tastes have also been preserved by many local traditions, customs and national culture.